News and analysis
Application speed: today’s load and tomorrow’s data growth
Postman and Tiger Data address different performance checks. Connect API load testing with query behaviour as the data history grows.
A page opens quickly against a small test database, but that does not establish what happens after orders accumulate. Conversely, a slow query against a large database does not show the load the whole API can handle. Two articles dated 9 October are useful to compare before releasing a feature that will become part of the team’s daily work.
Repeatable load tests the current journey
Postman described cloud performance testing, where collections run through a cloud runner, results are shared with the team and CI can enforce a passing condition. The account region determines load geography. These properties help organize comparisons, but do not establish your application’s performance.
For acceptance, first define the operational journey. A person searches for an order, opens it and saves a change: several connected actions. Repeating one conveniently cached request can produce an attractive number while leaving the main journey untested. Distinguish the expected user flow from a short burst of activity when that burst actually occurs in the business process.
A growing history changes individual queries
Tiger Data discusses measuring IIoT query degradation using observations of execution time and data size, including row and tag counts. It examines differences between cumulative counters and comparisons of growth models. Its example concerns the stated scenario; it does not establish an overload date for another system.
For your database, this prompts a check that different causes of slowdown are not being mixed together. More records, more distinct entities and a changing query distribution can have different effects. A narrow measurement range does not justify confidently extending a trend a year ahead.
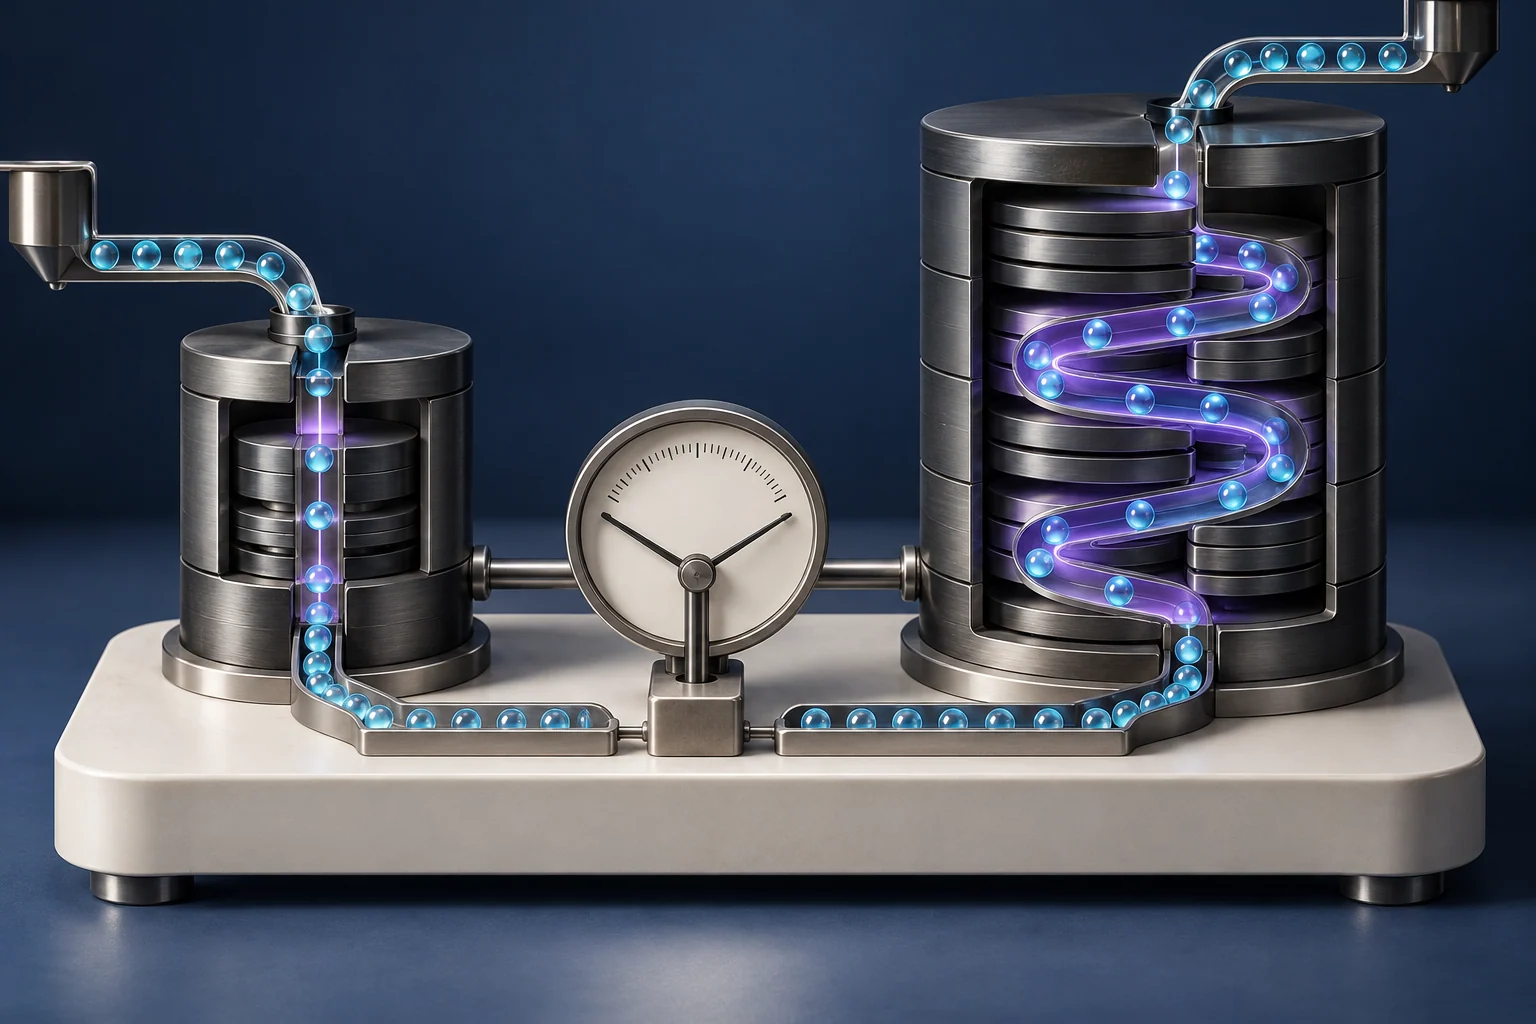
Bring both checks into one release decision
The comparison suggests a design approach: a load test checks the complete journey under specified conditions, while query observations help explain how it changes as history grows. Neither replaces the other. Before testing, agree acceptable waiting time, error rate and result completeness.
Prepare an anonymized sample dataset with a realistic structure. Run the journey at several data volumes while keeping comparison conditions consistent. Check the correctness of saved changes as well as response duration. If the test fails, identify the bottleneck before purchasing more capacity.
Keep run settings and passing criteria alongside results. After a query changes, the team can repeat the exercise and establish what actually improved. Do not import a vendor’s thresholds or forecasts without verification against your own workflow.
Our guide to moving from spreadsheets to systems helps define data boundaries. The historical Mailwizz analytics case supplies integration context, not a modern benchmark. For reporting automation, discuss historical data volume and the user journey before expanding the feature.