News and analysis
Follow a request: connect the error, trace and collector
OpenTelemetry, Sentry and Grafana expand different observability layers. Verify the path from a user action to an inspectable diagnostic record.
A customer says an order was not saved. One log contains an error; another shows a successful operation. The team cannot establish whether they describe the same action. Three October publications help distinguish obtaining request context from managing the system that collects it.
Trace-log correlation has conditions
On 6 October, OpenTelemetry described correlation through OBI. Trace and span context can be added to stdout/stderr logs when an active request context exists, without an application SDK or rebuild. This does not promise automatic correlation for every log source.
For an owner, the useful result is concrete: the team finds records for the relevant action and identifies where it stopped. Before adoption, establish the log sources in use and whether they can be connected to a request. An identifier alone does not explain what reached the database or whether the next step completed.
Application instrumentation uses another mechanism
On 9 October, Sentry described JavaScript SDK v11, using a code transformer and diagnostic channels for runtime and build instrumentation. It retains the OpenTelemetry standard relationship, but is not identical to OBI’s mechanism.
The comparison helps identify the observation layer. Different mechanisms can provide context, while coverage needs checking against the actual journey. Do not transfer requirements from one tool to another merely because both display traces.
Collectors need their own owners
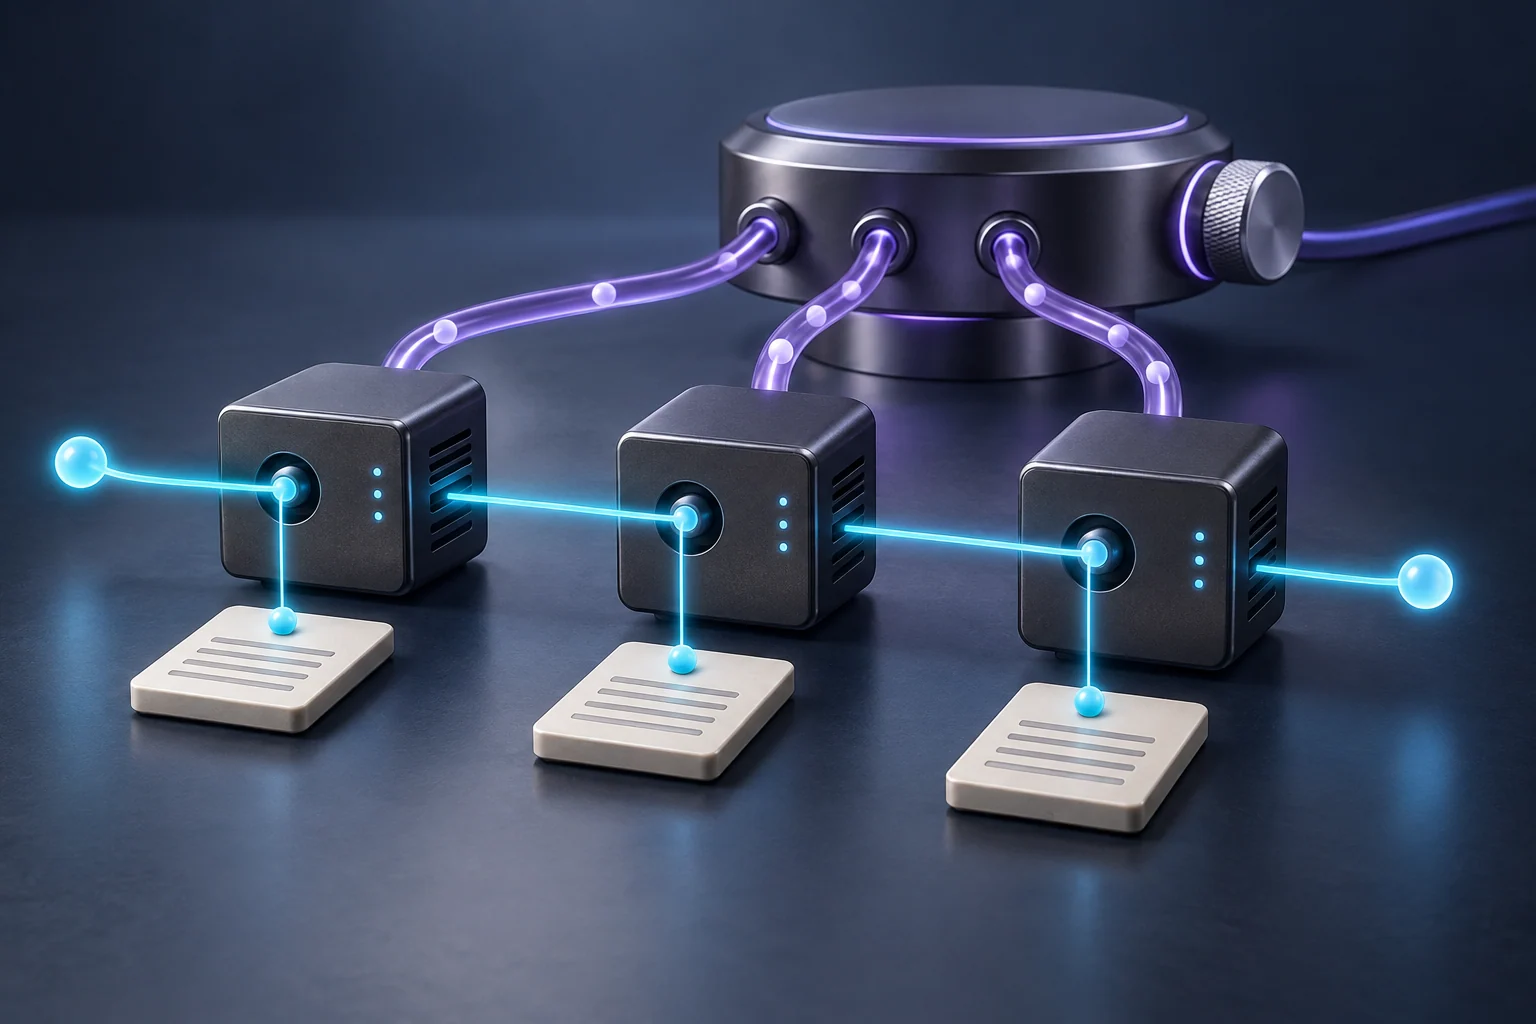
On 8 October, Grafana announced GA OpAMP support in Fleet Management for supported OpenTelemetry Collectors. Central management concerns configuration, pipelines and collector health; a mandatory migration to Alloy is not established for every case.
The three articles connect a complete path: obtain context, transport diagnostic data and maintain the collection configuration. If a collector stops, an absence of errors in a dashboard does not prove that the application is healthy. Expose the state of this intermediate layer too.
Accept the setup with one failed operation
In staging, trigger a controlled persistence error. Follow the request, application records and transport into the diagnostic interface. Repeat the action and establish that its events do not get mixed with the first attempt. Check a background continuation separately, where context may need explicit propagation.
Assign someone to own configuration and data-loss checks. Keep enough context to investigate without unnecessarily copying customer request content. The comparison suggests that observability earns its value through reconstructing the action, rather than the number of connected tools.
Our server core guide helps describe state. The archived infrastructure material covers diagnostics without confirming these new connections. For your operations, discuss the route from an error to its responsible owner.